
One approach to complex systems is to consider that the behaviour of the system can be considered to be a vector field in a phase space composed of differing variables. The task of understanding the complex system, then, is trying to deduce the map of vectors.
For instance, a phase space of global climate might be obtained by creating a scatter-plot of atmospheric CO2, global ice volume, and a mean deep ocean temperature. Each observed set of variables plots as a single point on the graph, and is called a state. The trajectory traced out by the observed succession of states follows the vector field locally, and gives us some insight into the nature of the vectors in that limited region of phase space.
Similarly, we might try to study the unemployment/interest-rate system. Here, too, the observed succession of states gives us a partial picture of the vector field that comprises the system.
For those times when you only have a single time series, Packard et al. (1980) (pdf) prescribe means of reconstructing phase space portraits so that you can still investigate the vector field that defines your system. The method used most commonly on this blog has been the time-delay method.
Below we see the reconstructed phase space by the time-delay method for ten years of the gold/silver ratio (based on month-end prices).
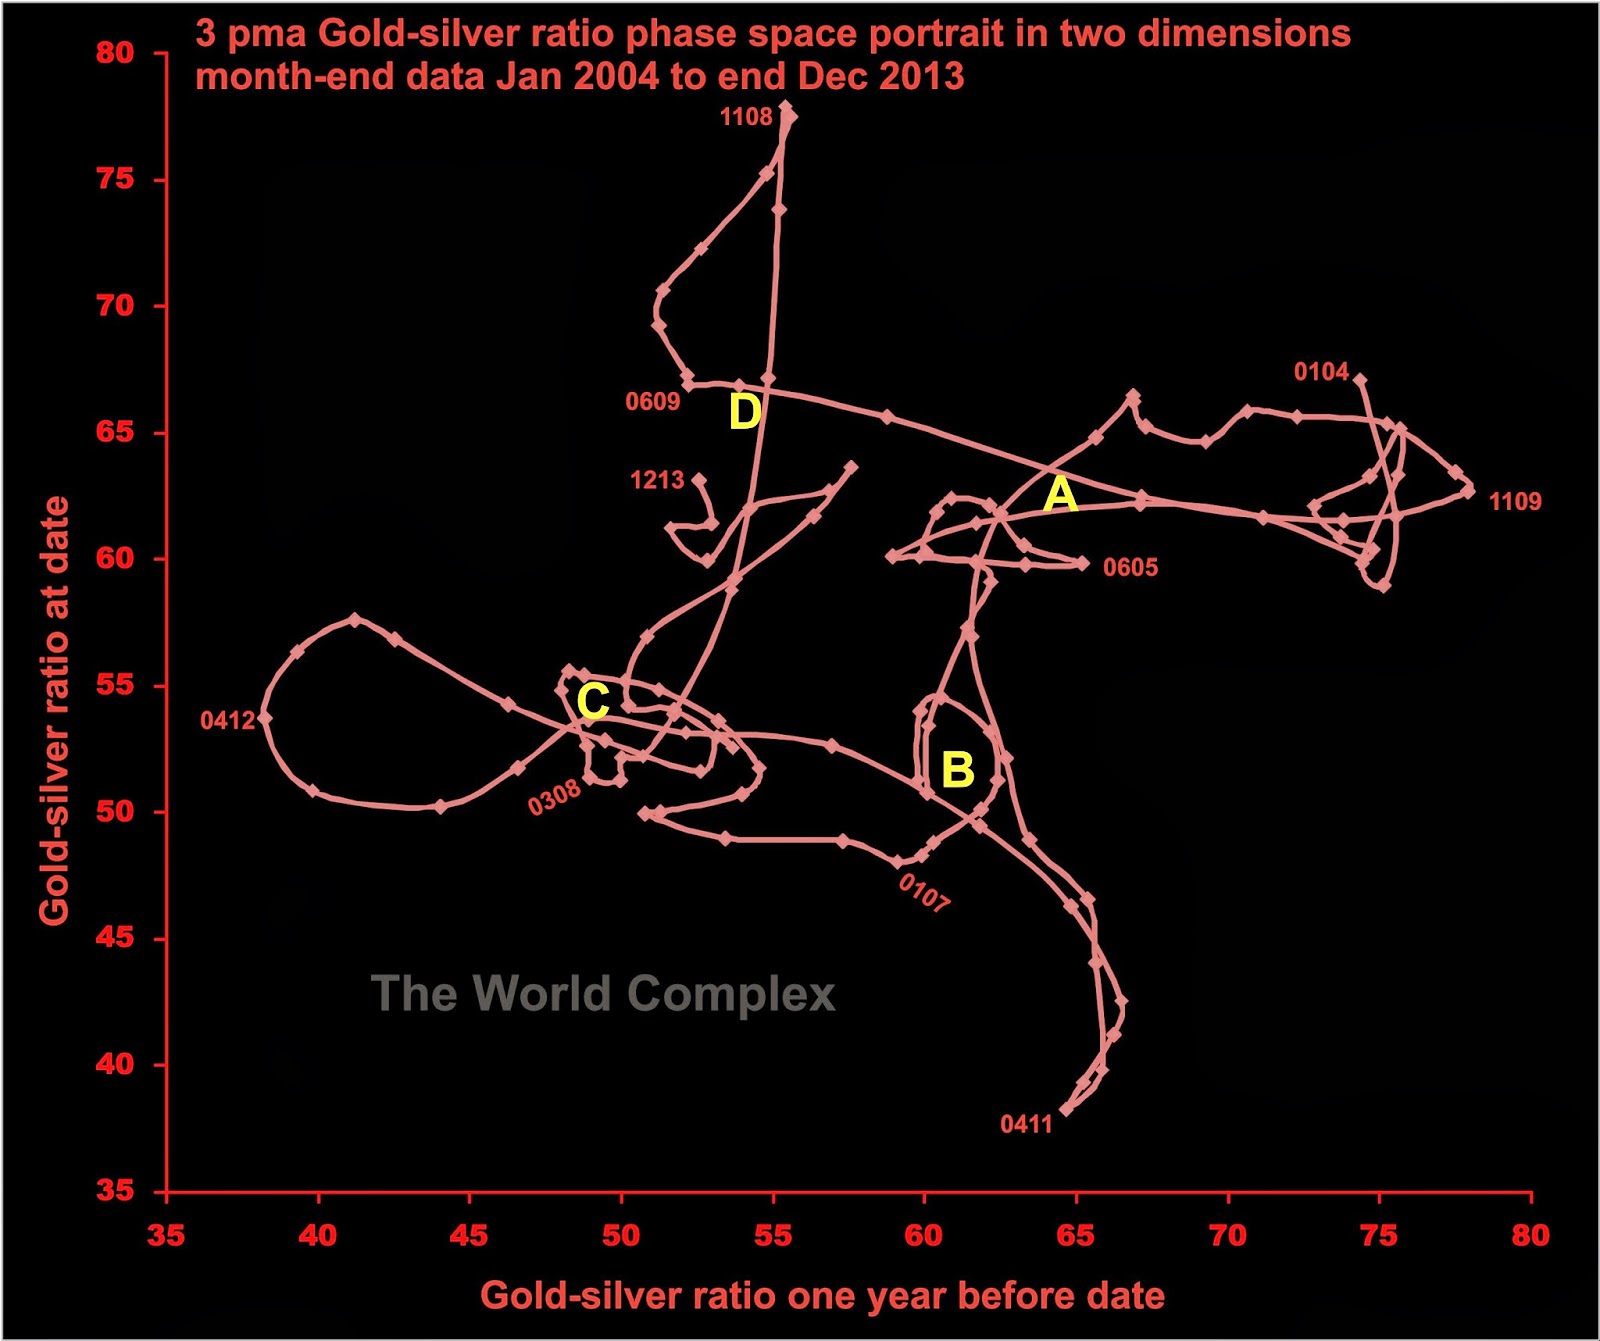
The loops we see extending beyond the position of the letters represents some kind of overshoot.
The vector field that we infer from this diagram is a clockwise closed loop. Like when water goes down a drain.
For instance, a phase space of global climate might be obtained by creating a scatter-plot of atmospheric CO2, global ice volume, and a mean deep ocean temperature. Each observed set of variables plots as a single point on the graph, and is called a state. The trajectory traced out by the observed succession of states follows the vector field locally, and gives us some insight into the nature of the vectors in that limited region of phase space.
Similarly, we might try to study the unemployment/interest-rate system. Here, too, the observed succession of states gives us a partial picture of the vector field that comprises the system.
For those times when you only have a single time series, Packard et al. (1980) (pdf) prescribe means of reconstructing phase space portraits so that you can still investigate the vector field that defines your system. The method used most commonly on this blog has been the time-delay method.
Below we see the reconstructed phase space by the time-delay method for ten years of the gold/silver ratio (based on month-end prices).
The four-step dance in the reconstructed phase space of the gold-silver ratio continues apace (note that I hae switched the axes in an ongoing attempt to make all my plots consistent, so the above image is the mirror image of the figure in the last article, but the mirror plane is the diagonal). So in the above plot, we start at A, move to B, then C, then D, back to A, and so on. Presently, we are marching on our way to D, which we should reach within the next two months. I don't know if this means anything, but the last time we were at point D, we were in the middle of a full-blown financial crisis.
The vector field that we infer from this diagram is a clockwise closed loop. Like when water goes down a drain.
No comments:
Post a Comment